Search:
ASSESSING THE DEGREE OF DANGER OF DEFECTS
IN THE WELDED JOINTS OF STEEL PIPELINES
IN THE WELDED JOINTS OF STEEL PIPELINES
Defects of welded joints create great risks during long-term of steel pipelines operation, concentrating of mechanical stress and having an ability to propagate quickly and unpredictably, leading to unexpected destruction [1-6]. In fracture mechanics, for an objective assessment of the danger of a metal defect in a steel pipeline detected by technical means of flaw detection, it is necessary to determine shape, linear dimensions and orientation of defect relative to stressed state of the metal. Based on these empirical data, a calculated estimation of the concentration of mechanical stresses near the defect and its criticality for the strength of the metal is made.
Studying natural defects, defect model whose face surface has the shape of an ellipse is widely used [4-6]. To calculate the value of the greatest mechanical stress near the vertex of an infinitely extended elliptical defect (fig.1, defect A), Here is a formula:
σmax = Pd/2t (1+2a/b), (1)
where 2a, 2b are linear dimensions of the defect, σ0 is the nominal mechanical stress of the metal, the value of which for a steel pipe is assumed to be equal to the circumferential stress σ0 = σy0 = Pd/2t [3], while:
– in vertices of defect А: σA max = Pd/2t (1+2a/b), (2a)
– in vertices of defect B: σB max = Pd/2t (1+2b/a), (2b)
where Р is the pressure inside of the pipe, d is the outer diameter, and t is thickness of the pipe wall.
Fig.1. Assessing the danger of metal continuity defects in a steel pipe
From formula 2 follows that if other external conditions are equal, the σA max >> σB maxit means, the defect A is the greatest danger for pipe, and the defect B is the least. Moreover, at early stages the size of defect A may be an order smaller than the size of the defect B, while the defect A will still be more dangerous than the defect B, having a tendency to rapid and unpredictable growth due to high stress concentration. According to the technical regulations [2, 7], the degree of danger of defects detected during flaw detection of a steel pipeline is determined by comparing its linear dimensions with the specified threshold values. With this approach, the considered continuity defects A and B will be classified as equally dangerous for the strength of the steel pipe metal, which, however, does not fully correspond to reality.
If we take into account that an area with an increased stressed state of the metal is formed near dangerous defects, then comparing the results of its inspection with the measured linear dimensions of the defects, we can fairly confidently assess their danger.
This is evidenced by the results of hydraulic tests of the bench constructed from a two-pipe lash made of steel pipes of a former main gas pipeline with an outer diameter of 530 mm (fig.2).
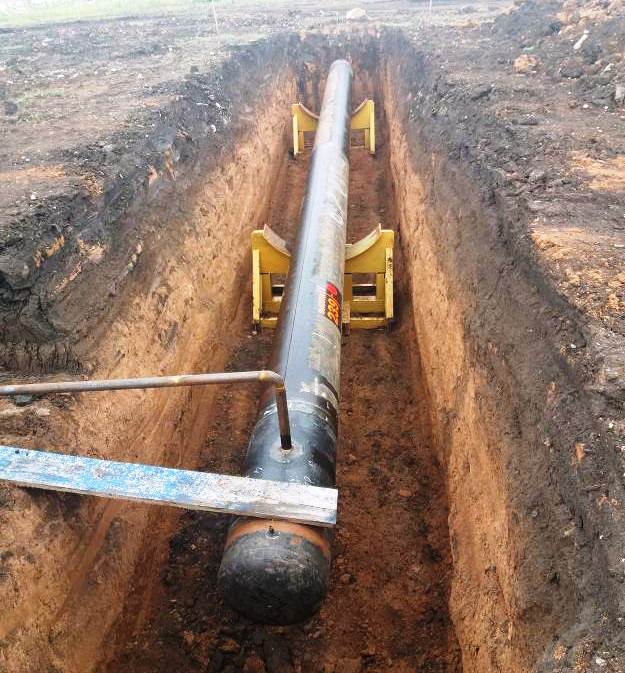
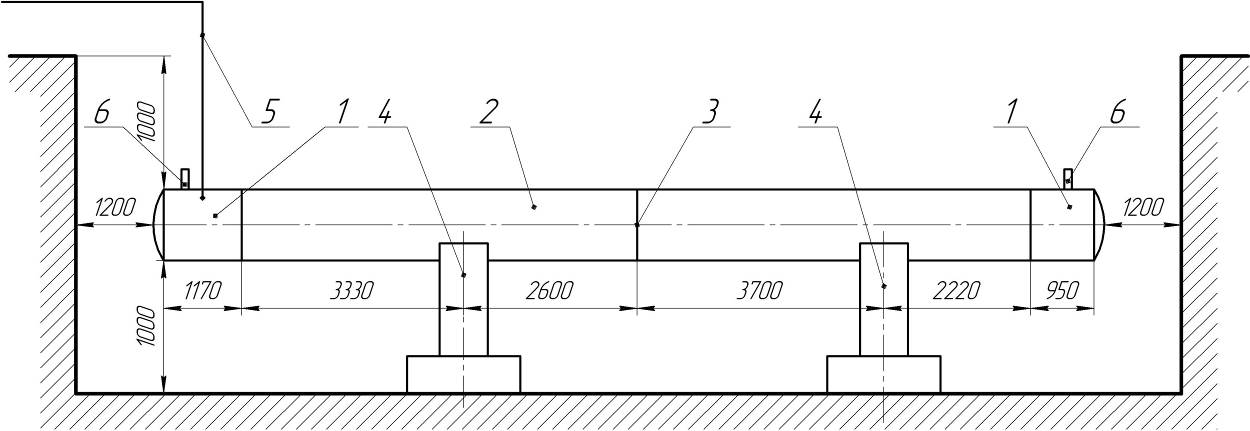
Fig.2. Full size hydraulic bench for steel pipeline fatigue tests
1 – steel plug, 2 – steel pipe, 3 – ring welding seam, 4 – support, 5 – test loop, 6 – fitting.
To simulate operation a five-year period of steel pipeline, test bench was subjected to variable loads with the number of cycles N=150. The fatigue life test was performed by hydraulic pressure loading, from a minimum value of Pmin = 2.6 MPa, to a maximum value of Pmax = 5.4 MPa, with a pressure hold for 2 minutes at each pressure value.
To control the changes of the stress state of the bench during testing, the IN-02 metal stress indicator was used; A1550 IntroVisor ultrasonic flaw detector was used to identify and evaluate the linear dimensions of defects (fig.3).
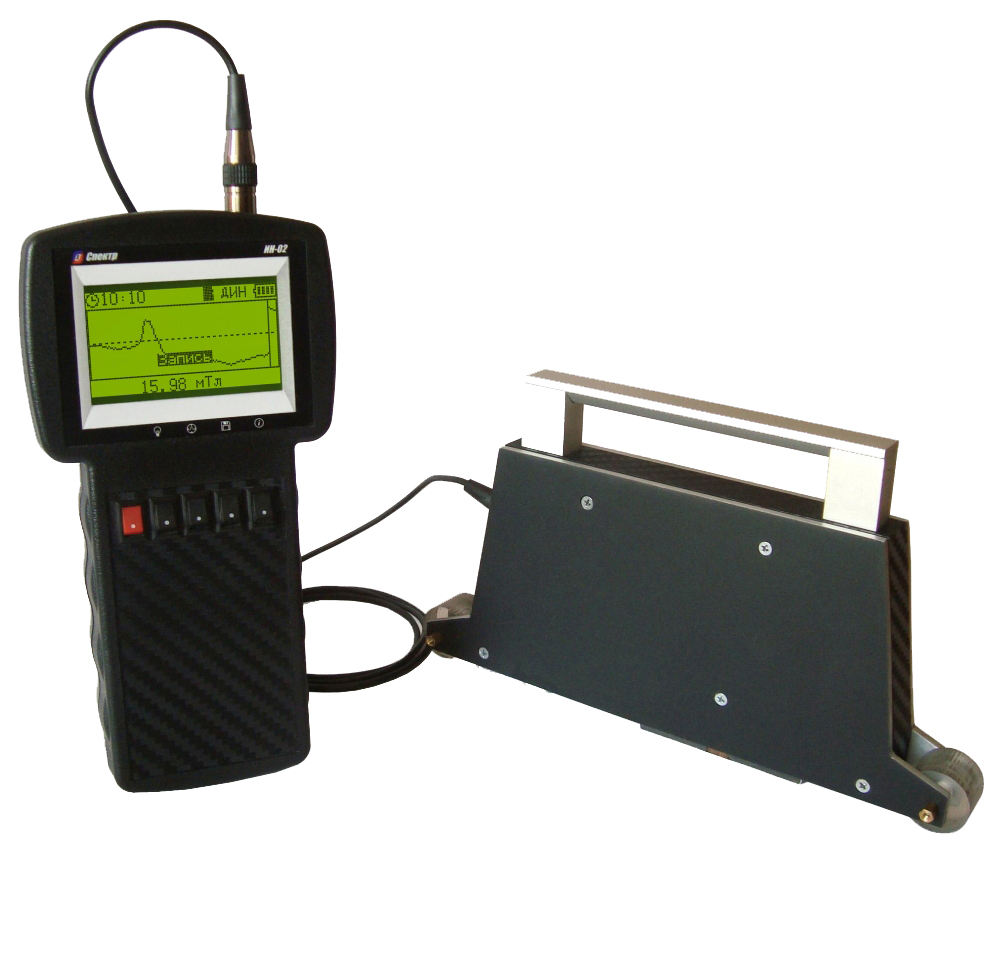
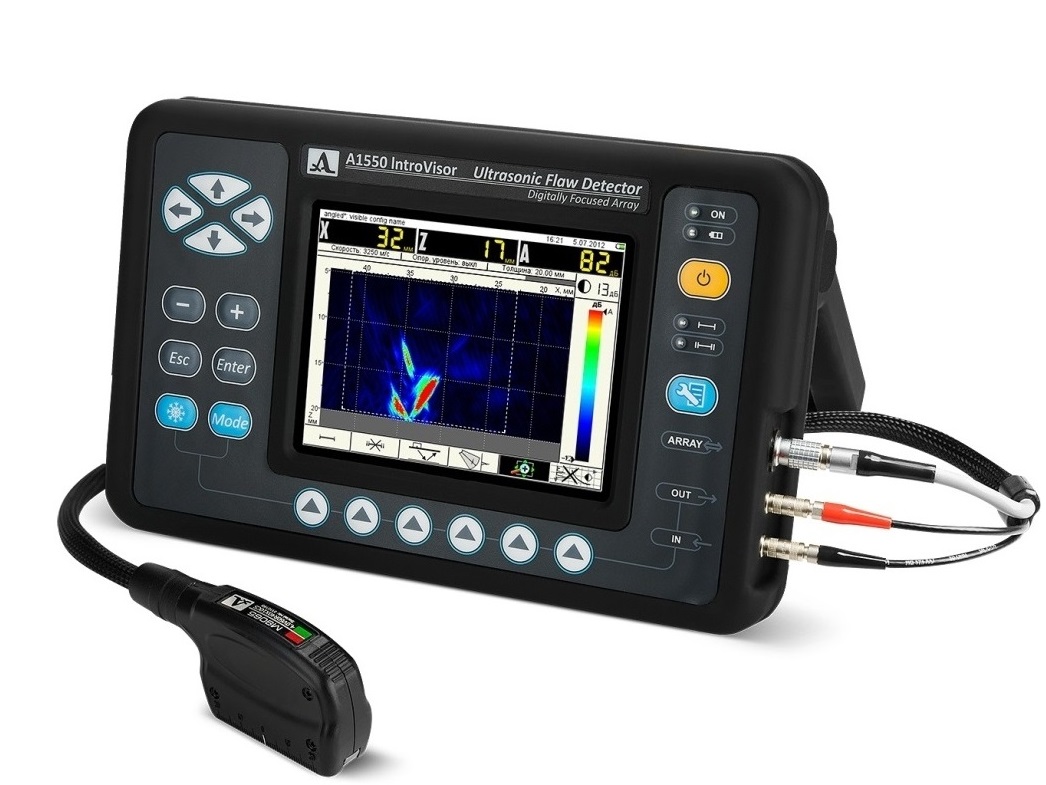 Fig.3. IN-02 metal stress indicator and A1550 IntroVisor ultrasonic flaw detector
Inspecting the stressed state with IN-02 metal stress indicator, the 8 areas with an increased level of stressed state of the metal were detected in the near-seam zones of longitudinal pipe welds (fig.4, 5), while no significant stress concentrations were detected in the metal (fig.6a).
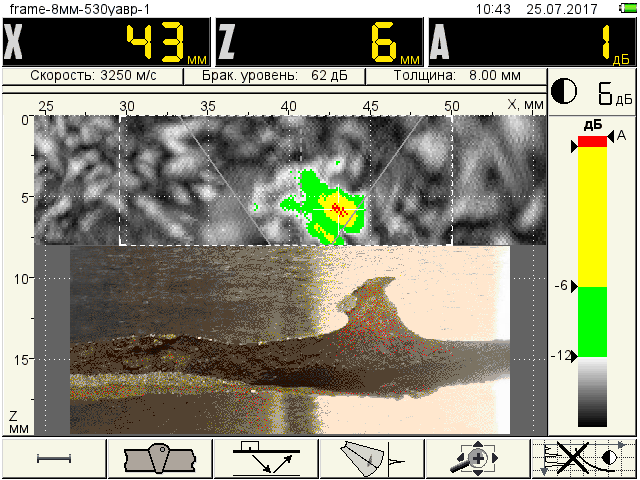
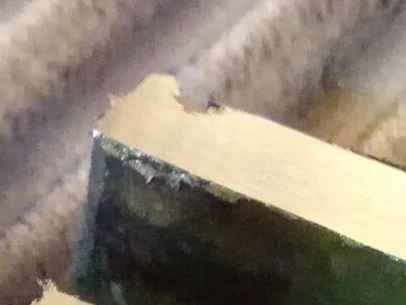
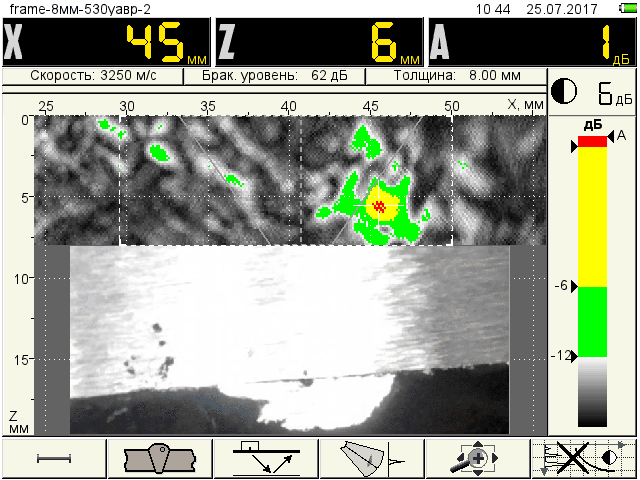
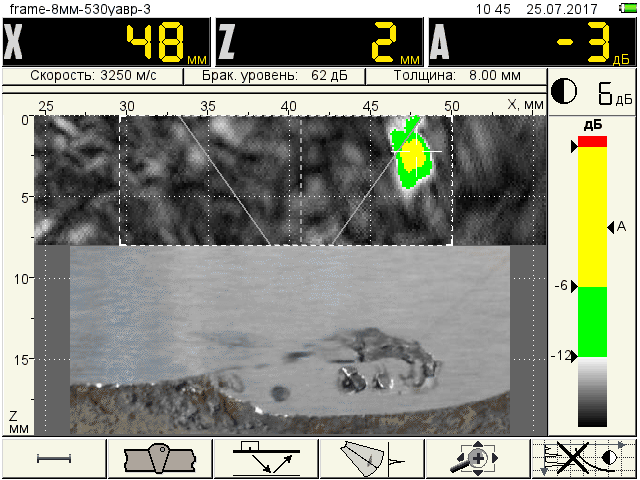
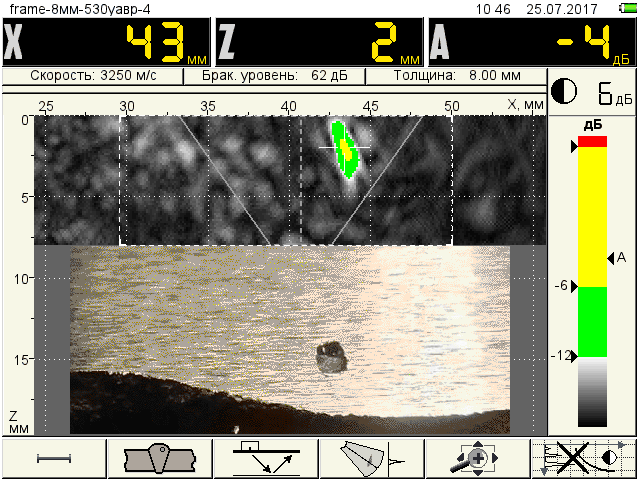
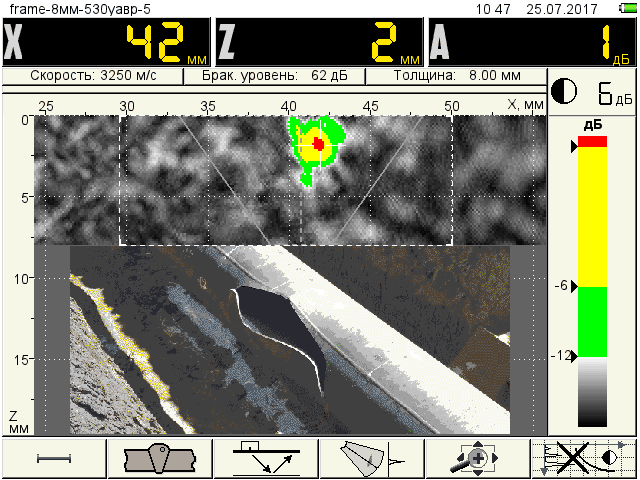
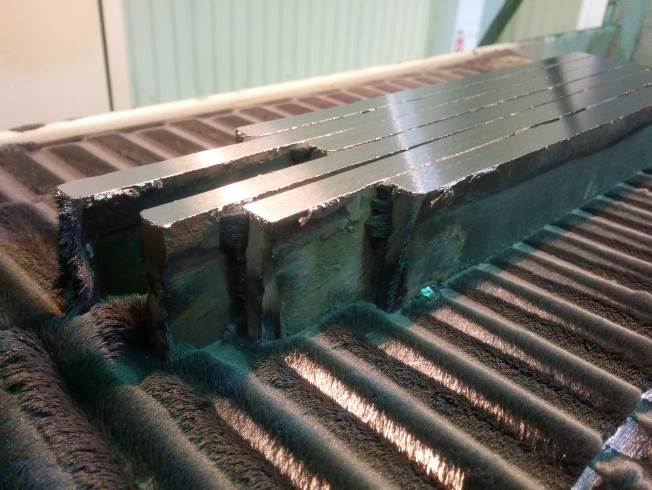
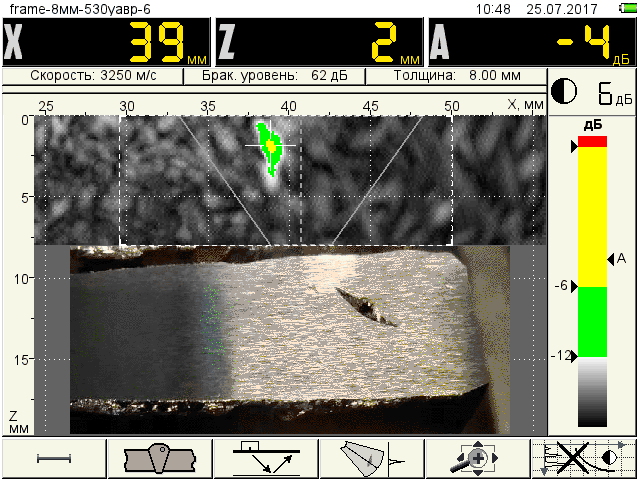
In these places with an increased level of stressed state of the metal, excluding areas H2 and H7, the ultrasonic flaw detector A1550 IntroVisor found several defects (fig.5), the linear parameters of which were measured after the test was completed by layer-by-layer grinding of the defective metal sections and studying them in the laboratory under a microscope.
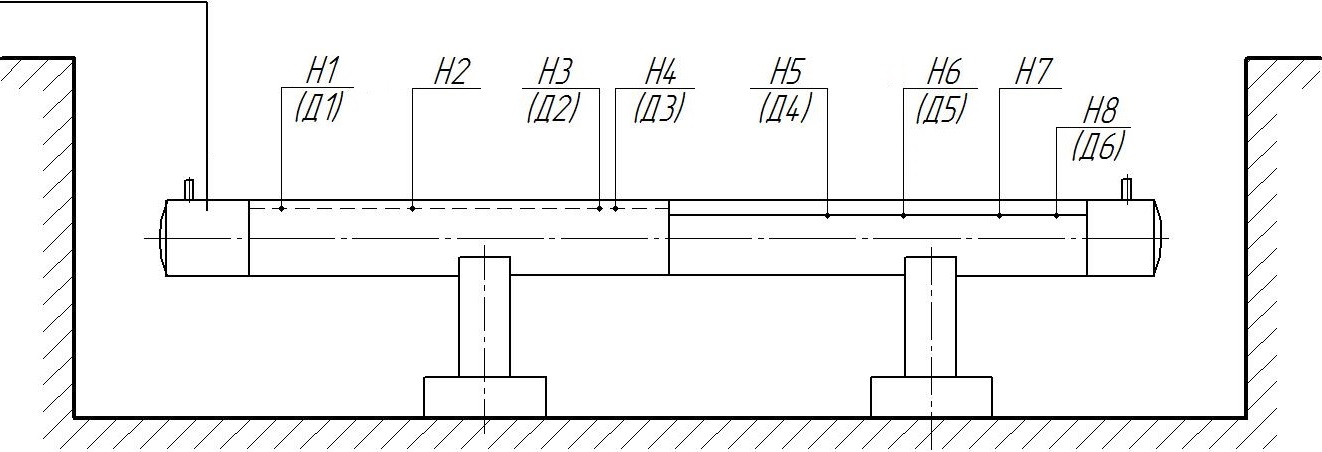
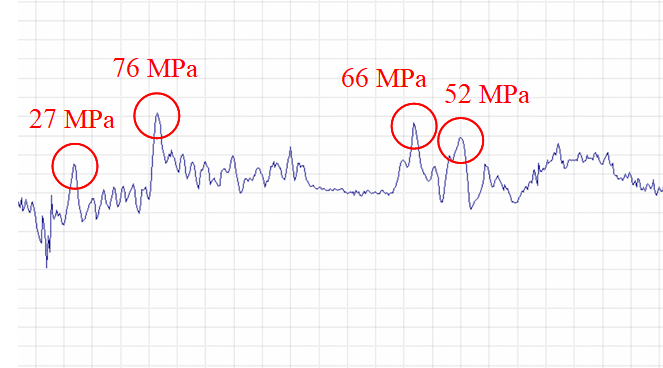
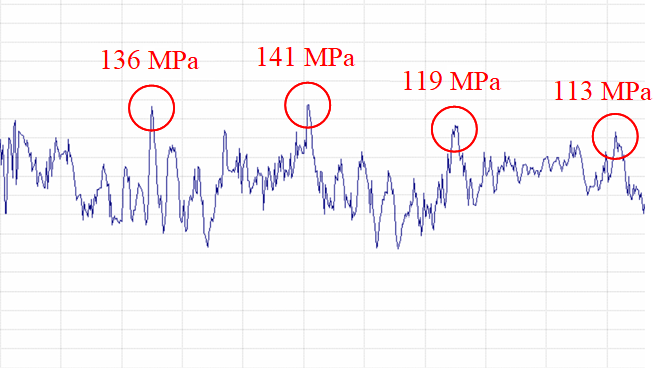
Fig.4 Layout of the stressed areas of the metal and defects in longitudinal welds
 |
 |
Н1 – the hole of 2.5 mm |
Н2 – 1.5×2 mm pipe wall edge cutting |
 |
 |
H3 – a group of gas pores of 0.2-0.5 mm |
H4 – a group of gas pores of 1.0-1.5 mm |
 |
 |
Н5 – 1 mm gas pore |
Н6 – D5 defect, length 2 mm |
 |
 |
Н7 – no defect existed |
Н8 – 1.5×5 mm slag inclusions (D6) |
Fig.5. Defects in the specified areas with increased metal stress
All identified areas with an increased stressed state are associated with metal continuity defects, excluding H7 (in which there were no visible defects). It is assumed that the increased level of mechanical stress of the metal in this area is associated with local heterogeneity of the metal structure or element composition.
During ultrasonic inspection in the H2 area, the edge cutting defect with a width of 1.5 mm and a length of 2 mm could not be detected due to the fact that it was located in the root of the weld, despite the fact that according to the indications of the metal stress indicator IN-02, the most dangerous level of metal stress within this weld was observed in the specified place.
According to the results of the metal stressed state inspection, the most dangerous of the detected defects is the D5 weld defect, which creates the highest concentration of mechanical stress in the near-weld zone of 141 MPa.
According to the results of the ultrasonic testing, the most dangerous of the detected metal continuity defects is the hole D1, which has the largest linear dimensions, and formed as a result of the exit of a pore with a diameter of 2 mm and a depth of 4 mm on the inner surface of the pipe. The second largest and most dangerous defect according to the results of the UT is the D5 defect, which at the time of the start of tests has a length of 2 mm.
However, the measured stress level in the near-shock zone near the D1 defect is only 27 MPa, so the D1 defect was found to be less dangerous than the D5 defect.
In the course of testing the bench for fatigue life after switching off the pressure every 50 cycles, a study of its stress state was carried out by scanning the surface of the bench with the IN-02 metal stress indicator along 12 profiles, approximately every 140 mm.
It is found that at each test cycle there is a gradual accumulation of metal fatigue and an increase in the overall level of stressed state (fig.6a, b, c). However, the H6 region could not always be detected reliably enough against the background of general changes in the stress state due to the fact that its length, as will be found later, is significantly less than the selected scanning interval (the distance between profiles).
On the 150th cycle, the fatigue life test was decided to stop and conduct a strength test, gradually increasing the internal pressure. At a pressure of 4.5 MPa, the area with an increased level of metal stress is reliably detected by the metal mechanical stress indicator IN-02 (fig.6b). With a further increase in pressure, the stress state of the bench was not monitored due to increased danger. At a pressure of 14.5 MPa, the bench was depressurized in the specified area of H6, and the mechanical tests were stopped.
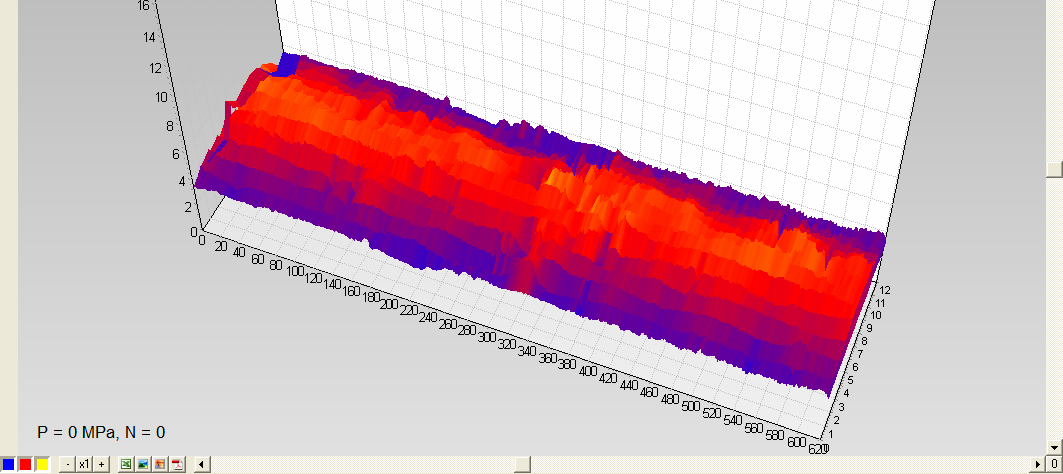
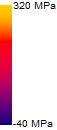
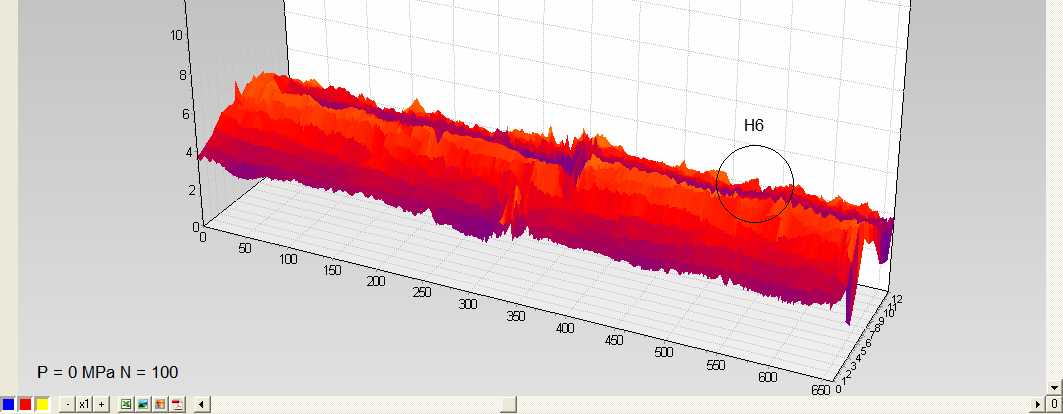
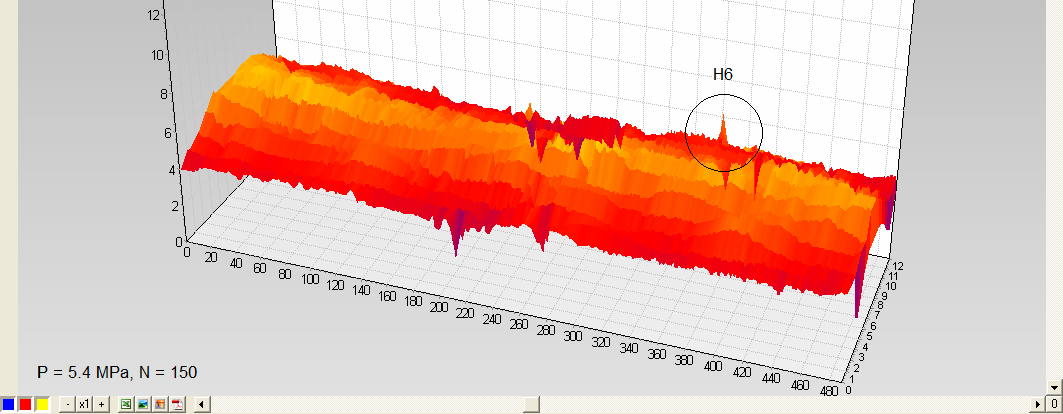
Fig.6. Observing changes in the stressed state of the pipe bench during the fatigue test and with further increase in pressure from 0 to 5.4 MPa
To estimate the spread of the distribution of mechanical stresses near the crack tip in the metal, we will use the edge crack model from fracture mechanics [6]. The distribution of the tangential (relative to the surface of the pipe) stress is described by the formula:
![]() (3а)
(3а)
Distribution of normal stresses is described by the formula:
![]() (3б)
(3б)
where ![]() is the coefficient of intensity of stresses for normal tear off the metal, h is depth of crack, t is thickness of pipe wall, (r, θ) are the polar coordinates of the point of measurement of mechanical stress relative to the top of the cracks (fig.7).
is the coefficient of intensity of stresses for normal tear off the metal, h is depth of crack, t is thickness of pipe wall, (r, θ) are the polar coordinates of the point of measurement of mechanical stress relative to the top of the cracks (fig.7).
Effective mechanical stress of the metal, as measured by the indicator of IN-02, approximately represents the superposition of the stressed state of the metal around the crack and the stressed state of the pipe without defects under the action of pressure P:
![]() (4)
(4)
where ![]() is the total circumferential stress;
is the total circumferential stress; ![]() is total normal stress;
is total normal stress; ![]() the total longitudinal stress in the metal over crack in the edge. Fig.7 shows the distribution of effective mechanical stress according to the formula (4) for cracks with a depth of 1 mm, 3 mm, and 5 mm.
the total longitudinal stress in the metal over crack in the edge. Fig.7 shows the distribution of effective mechanical stress according to the formula (4) for cracks with a depth of 1 mm, 3 mm, and 5 mm.
Half-width of the effective mechanical stress distribution over the edge crack ∆x is about 30 mm and practically does not depend on the depth of the crack.
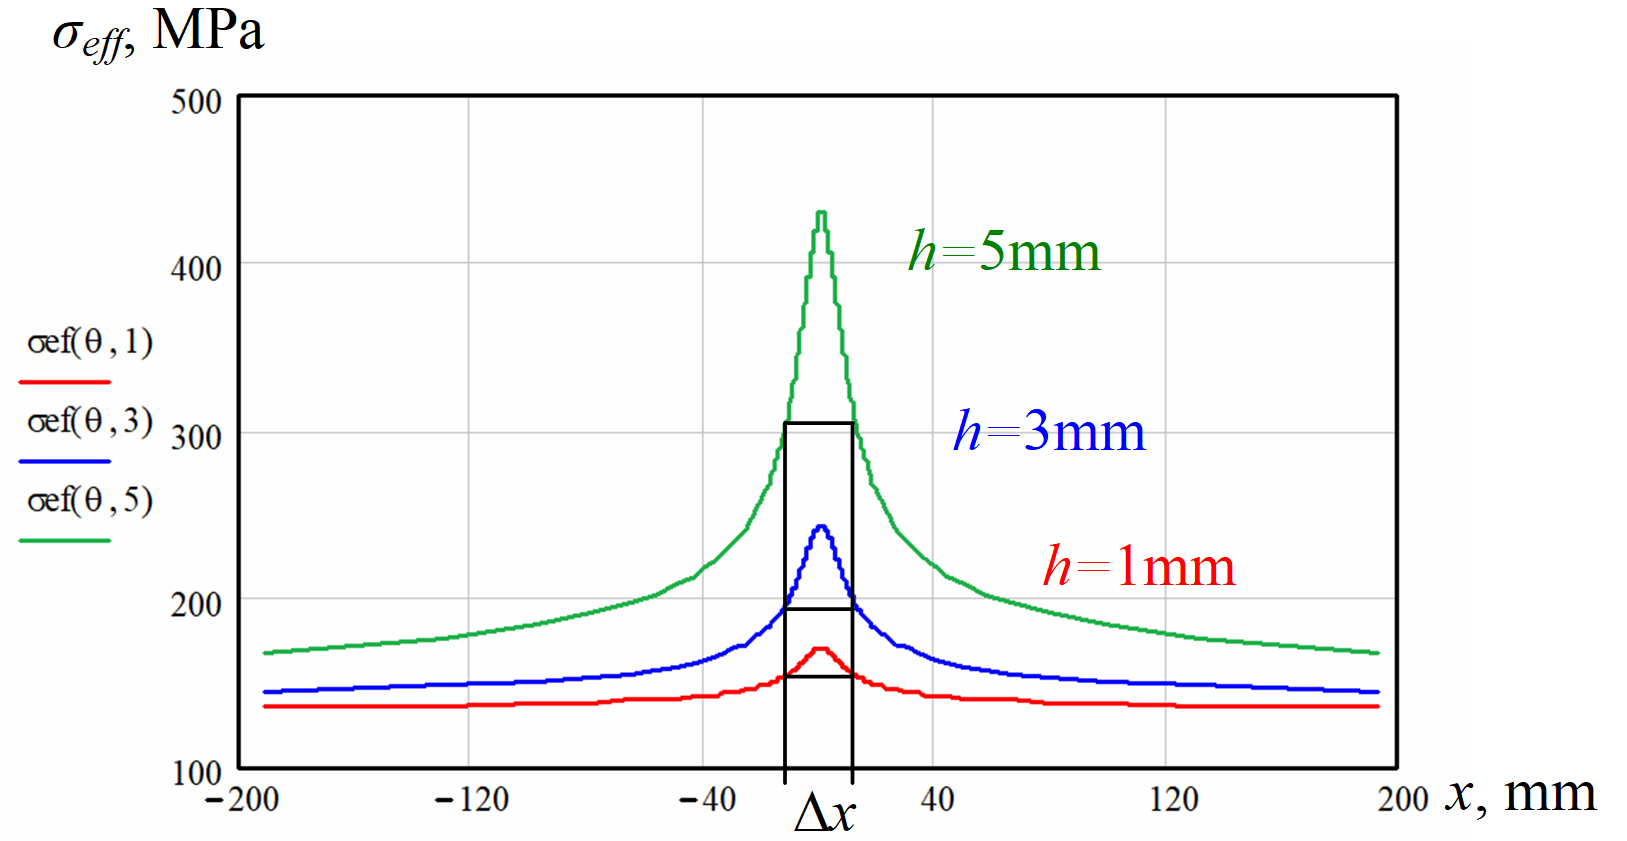
Fig.7. Effective metal stress distribution at different depths of crack
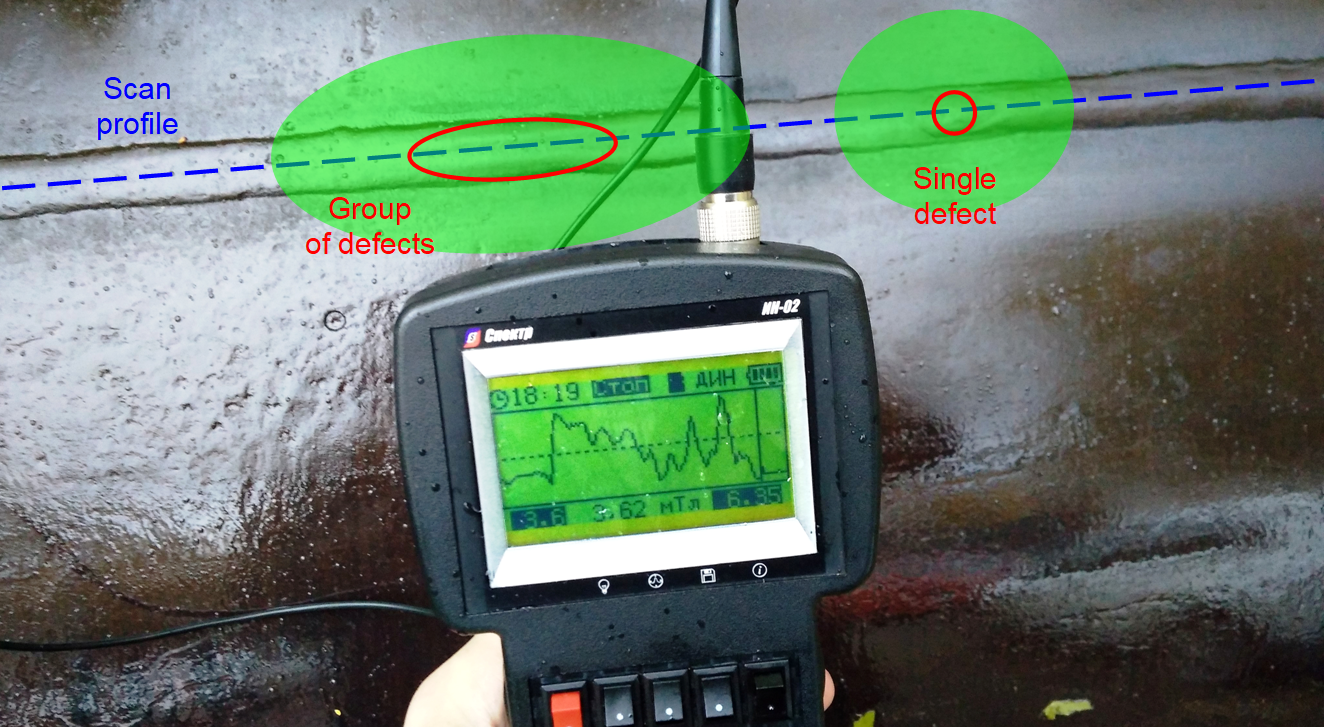
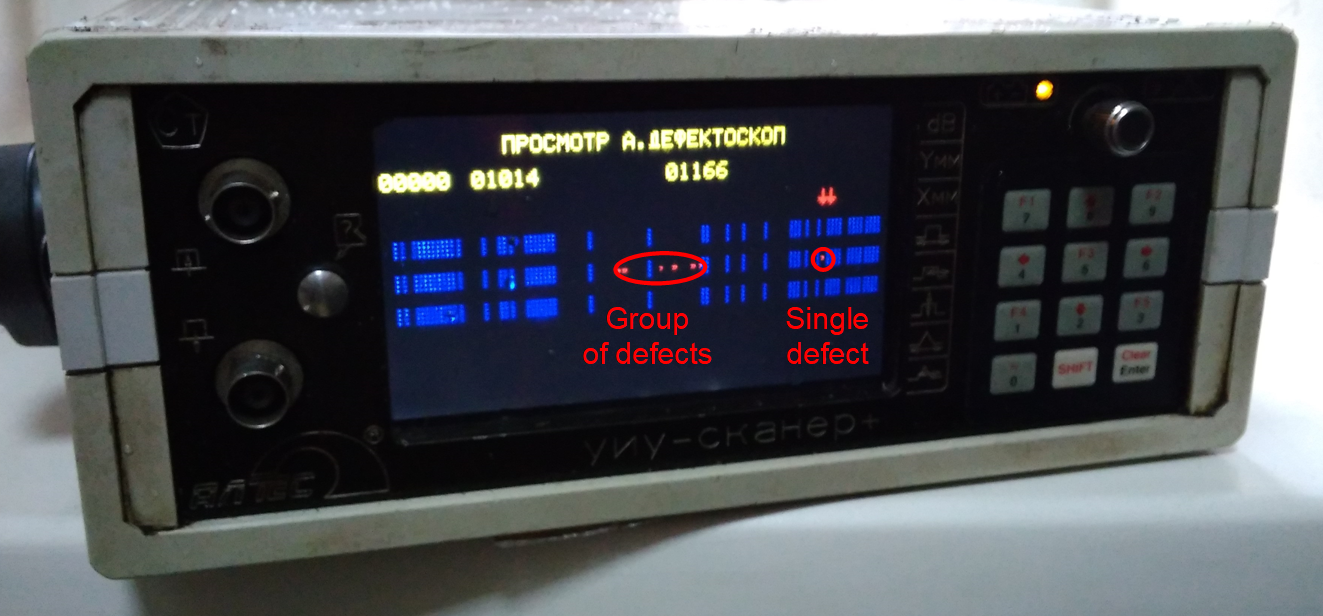
Fig.8. Measured distribution of metal stress in the weld with group of defects and with a single defect inside
Fig.8 shows measured distribution of metal stress in the weld of a steel pipe with a diameter of 1420 mm from a group of defects, and a single defect. When the group of defects is about 50 mm long, the half-width of the area with an increased level of metal stress is more than 80 mm; for a single point defect the half-width of the area of stress concentration is about 30 mm, which is quite consistent with the theoretical estimate according to the formula (4). It should be noted that this parameter repeatedly exceeds the half-width of the signal over the continuity defects measured by magnetic and electromagnetic flaw detectors [8].
References
1. Mitorhin M.YU., Veliyulin I.I., Kas'yanov A.N. i dr. Analiz sredstv i tekhnologij tekhnicheskogo diagnostirovaniya i otbrakovki trub pri provedenii kapital'nogo remonta linejnoj chasti magistral'nyh gazoprovodov OAO «Gazprom». – Territoriya neftegaz, 2010, №12, s.57-60.
2. STO Gazprom 2-2.3-095-2007. Metodicheskie ukazaniya po diagnosticheskomu obsledovaniyu linejnoj chasti magistral'nyh gazoprovodov. Moskva: OAO «Gazprom», 2008. - 43 s.
3. Darkov A. V., SHpiro G. S. Soprotivlenie materialov. M.: Vysshaya shkola, 1989. 624 s.
4. Parton V.Z. Mekhanika razrusheniya: Ot teorii k praktike. – M.: Nauka, 1990. – 240 s.
5. Mahutov N.A. Konstrukcionnaya prochnost', resurs i tekhnogennaya bezopasnost'. CHast' 1. Novosibirsk: Nauka, 2005. – 494 s.
6. Nikolaeva E.A. Osnovy mekhaniki razrusheniya. – Perm': Izdatel'stvo Permskogo gosudarstvennogo tekhnicheskogo universiteta, 2010. – 103 s.
7. GOST R 55724-2013. Kontrol' nerazrushayushchij. Soedineniya svarnye. Metody ul'trazvukovye.
8. Zagidulin R.V., Zagidulin T.R., Konnov A.V. Nekotorye osobennosti v raspredelenii signala vihretokovogo preobrazovatelya nad defektom sploshnosti metalla v postoyannom magnitnom pole. – Kontrol'. Diagnostika, 2013, № 8 (182), s.16-21.