Search:
AUTOMATED RECOGNIZING AND CLASSIFYING THE METAL DEFECTS ON THE
EDDY CURRENT SCANNING FLAW DETECTOR SIGNAL USING THE WAVELETS
EDDY CURRENT SCANNING FLAW DETECTOR SIGNAL USING THE WAVELETS
Stress-corrosion cracks, known as most dangerous kind of defects of the metal, are main reason of accidents occurring on the steel pipelines. Generally the stress-corrosion might be viewed as the group of defects of two basic types which are randomly arranged on the surface of metal: convenient cracks and pitting corrosion.
It is known that most sensible and selectable with respect to defects of metal given is eddy current nondestructive techniques, which is already embedded into automated multi-channel scanning flaw detectors ASD «Vikhr» and RSD-16 «Wavelet».
Vector diagrams on the figure 1 shows the distribution of eddy currents above single pitting corrosion and crack obtained from theoretical model of eddy current transducers (ECT) informative signal origins based on the assumption that the alternating magnetic field of eddy currents in the metal might be described by means of magnetic moments of them.
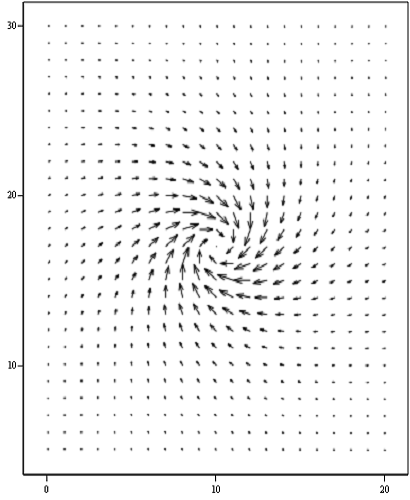
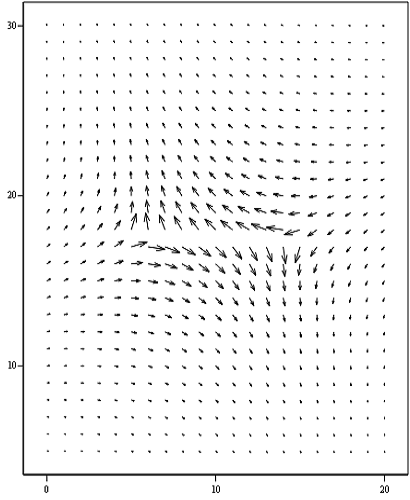
Fig.1. A distribution of eddy currents on the surface of metal with single defects of two basic types: left is pitting corrosion, right is crack
A fundamental difference between two distributions on the figure 1 is that when a pitting corrosion is scanned by surface ECT the contour lines of eddy currents in the metal should not change and always represents a conditional circular contour flowing around the edges of defect in certain direction. Also, when a crack is scanned by surface ECT the conditional circular contour of current is going to be split by defect into a two separated contours of more complex shape. The direction of eddy current in them remains as one of the initial contour, so they flow around the edges of crack in reverse direction.
So the signals of surface ECT measured on the crack and on the pitting corrosions have an opposite polarity; moreover, if we scan different cracks we will always observe significant changes of ECT measured signal phase, at the same time pitting corrosion will not cause to phase any essential influence.
On the figures 2-3 there are signals of surface ECT are presented measured by scanning a steel specimens with artificial defects of two basic types: cracks and corrosion of the metal. Eddy current transducer used to take the measures works on frequency of 10 kHz and it has two measuring channels: absolute (an impedance of primary coil of ECT) and differential (a derivative of the impedance by distance just scanned).
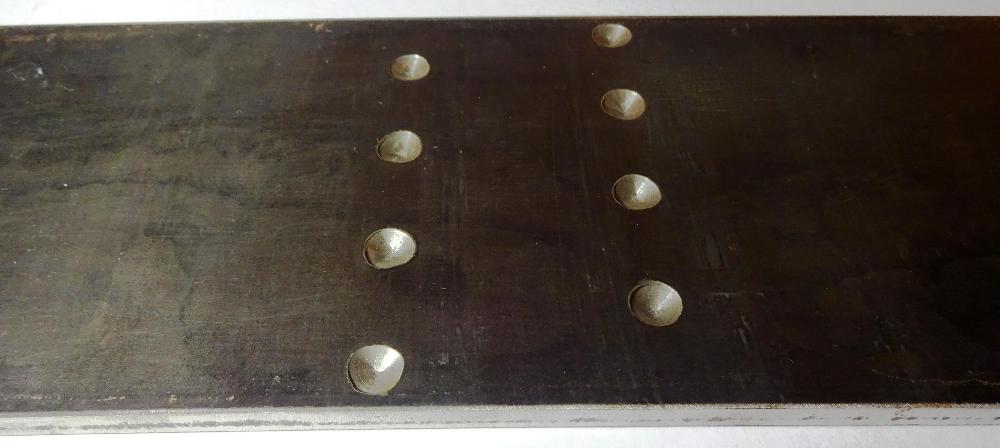
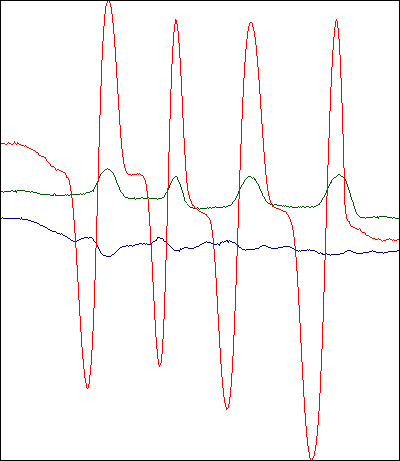
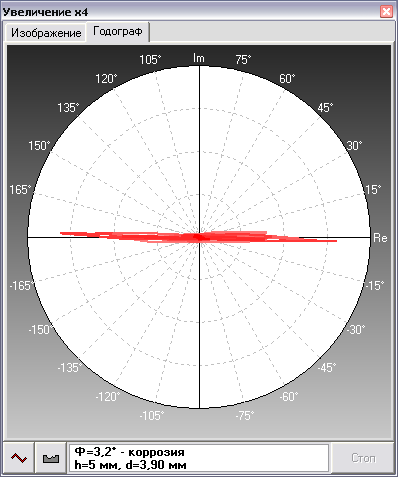
Fig.2. Signals of surface ECT measured by scanning the corrosion defects and their differential hodograph
Green path is the absolute measure channel of ECT;
Red – is the differential real;
Blue – is the differential imaginary
It might be noted the absolute channel of surface ECT on the pitting corrosion of metal has a positive polarity (see green path on the figure 2). At the same time the imaginary component of differential signal (presented by blue path on the figure 2) almost can be considered not changing with respect to its real component (red path on the figure 2). So when corrosion of metal is scanned the phase of differential signal of surface ECT almost will not changing and remains close to zero (see the hodograph on the right part of the figure 2).
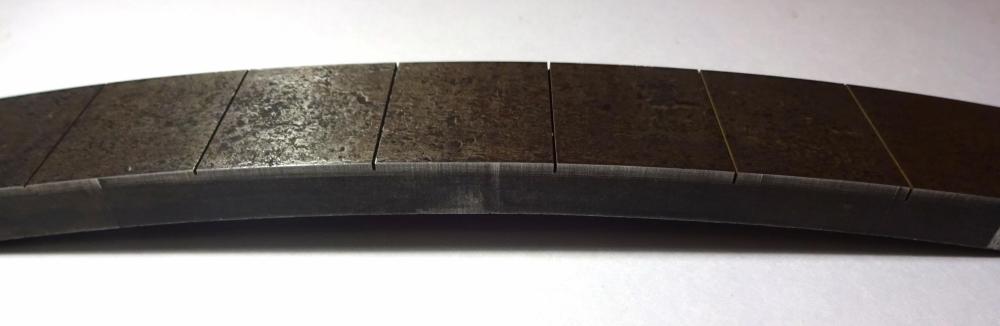
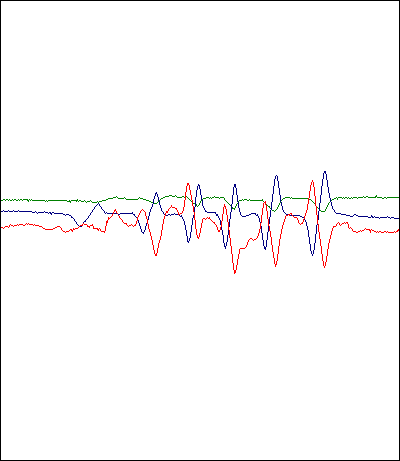
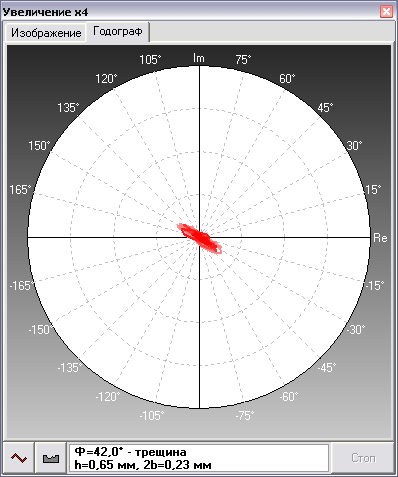
Fig.3. Signals of surface ECT measured by scanning the surface cracks of metal and their differential hodograph
Green path is the absolute measure channel of ECT;
Red – is the differential real;
Blue – is the differential imaginary
The absolute signal of the surface ECT on the crack has a negative polarity (see green path on the figure 3). At the same time the real and imaginary components of differential signal of surface ECT (red and blue paths respectively on the figure 3) are both changing very alike by the magnitude, but oppositely by the signs, therefore phase of differential signal of surface ECT usually turns close to 45° (see the hodograph on the right part of the figure 2).
Features of the surface ECT signals measured found here are specific for basic types of metal defects considered and consists full accordance with conclusions of theoretical model.
Moreover, obtained by the terms of the model given the algebraic functions (1)-(2) approximating the signals of surface ECT from different defects of metal meets enough the general mathematic requirements for wavelets (3)-(4) (figure 4):
![]() ,
(1)
,
(1)
![]() ,
(2)
,
(2)
where z – is lift-off value between surface ECT and surface of the metal inspected, h – is parameter directly related to the depth of the defect.
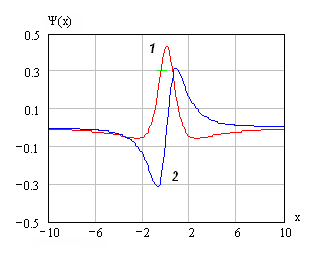
Fig.4. Algebraic wavelets: 1 – ψabs(x), 2 – ψdiff(x)
– have continuous power E on the all domain of the function R*:
![]() ,
(3)
,
(3)
– have enough narrow region of space X called as compact support of wavelet which is the function principally located in:
![]() .
(4)
.
(4)
Thus the functions (1)-(2) might be used as basic wavelets to automated recognizing the type of metal defects and classifying them on the wavelet analysis of ECT signals measured.
Wavelet transform of surface ECT signal measured S(x) carried out using the following expressions:
 ,
(5)
,
(5)
![]() ,
(6)
,
(6)
![]() ,
(7)
,
(7)
where ES(χ) – is the power of signal measured S(x), located inside compact support of wavelet function ψ(χ-х) at the given moment, Eψ – is the power of wavelet ψ(х).
When the absolute signal of the surface ECT measured S(x)=Sabs(x), is analyzed the ψabs(x) function (1) is need to take as the basic wavelet.
When the differential components of the surface ECT signal measured S(x)=Re(dSabs(x)/dx) or S(x)=Im(dSabs(x)/dx) is analyzed the ±ψdiff(x) function (2) is need to take as the basic wavelet.
A multiplying factor 100 is introduced into expression (5) in order to normalize the coefficients W(x) of wavelet transform obtained. Detection of defects is carrying by comparison the coefficients of wavelet transform obtained with the sensitivity threshold P, value should be preliminarily set up into the range from 0 to 100.
A scans on the figure 5 representing the same fragment of steel pipeline by the terms of absolute, real and imaginary signals of surface ECT have a crack on the background of intensive corrosion of metal. It is obvious, the crack existing could not be reliably detected directly on the signals given due to suppressive influence of intensive signal from the corrosion of the metal and also due to the high random noise taking place.
(a) (b) (c) (d)
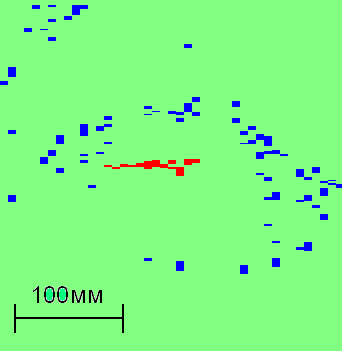
Fig.5. Fragment of steel pipeline inspection result obtained by eddy current scanning flaw detector, the pipeline has a crack on the background of intensive corrosion of metal
a, b, c – are signals measured, d – an image of defects detected, synthesized on the basis of wavelet transform these signals
In result of wavelet transform of surface ECT signals measured a vivid and intuitive picture of metal defects on the scan of the steel pipeline surface obtained (figure 5), which points their type and location.
On the figure 6 the algorithm of automated recognizing and classifying the metal defects detected on the differential signals of surface ECT measured in the real time mode.
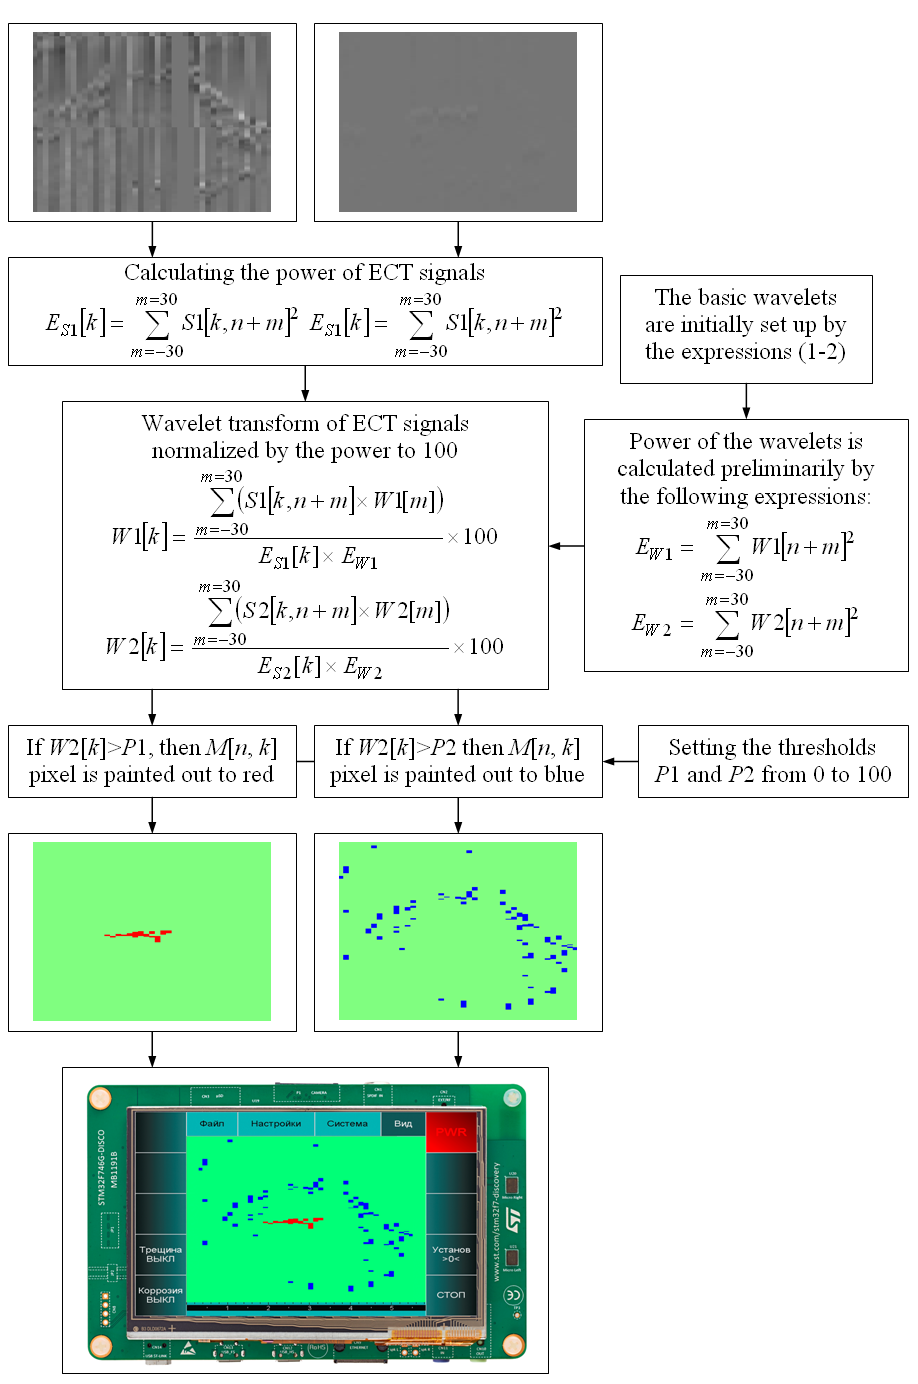
Fig.6. The algorithm of recognizing and classifying the metal defects detected on the differential signals of surface ECT measured in the real time mode
The algorithm described is used in the software embedded into the automated multi-channel eddy current scanning flaw detectors ASD «Vikhr» and RSD-16 «Wavelet».
An examples of the practice developed scanners and also examples of real stress-corrosion cracks detected by them in the natural industrial conditions might be watched here.